Trust Dashboard Overview
Overview of the Concord Trust Dashboard, covering audience metrics, questionnaire workflow, announcement engagement, and knowledge base usage.
Overview
The Trust Dashboard gives you a centralized view of how prospects, customers, and partners interact with your Trust Center. It is organized into four sections: Audience, Workflow, Announcements, and Knowledge & Engagement.
Navigate to Trust > Dashboard to access the dashboard.
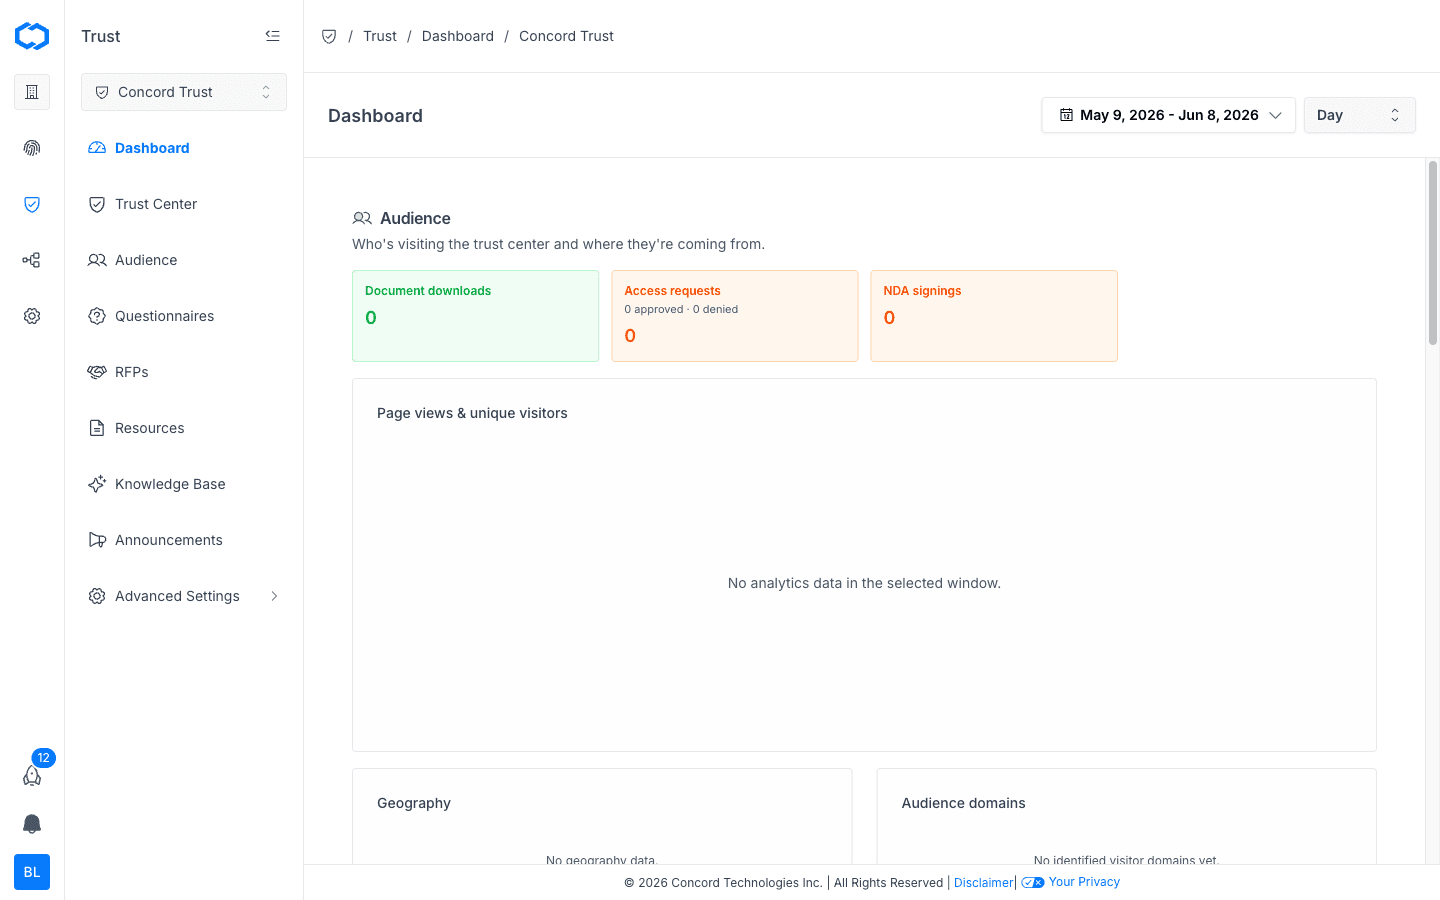
Date Range and Granularity
Use the date range picker at the top of the dashboard to select the reporting window. The granularity dropdown lets you switch between Day, Week, and Month views. All metrics and charts update to reflect the selected range.
Audience
Tracks who is visiting your Trust Center and where they are coming from.
Summary cards:
- Document downloads: total downloads across all featured documents.
- Access requests: total gated access requests, with approved and denied counts.
- NDA signings: total NDAs signed by visitors.
Charts and breakdowns:
- Page views & unique visitors: a time-series chart of traffic over the selected range.
- Geography: visitor location breakdown by region.
- Audience domains: identified visitor email domains, showing which organizations are reviewing your Trust Center.
Workflow
Tracks questionnaire throughput and cycle time.
Summary cards:
- Avg days to complete: average time from questionnaire creation to completion.
- Questionnaire exports: total questionnaires exported during the period.
Charts:
- Questionnaires created vs. completed: a time-series comparison showing intake volume against completion rate.
Announcements
Tracks subscriber announcement delivery and engagement. Metrics are populated by the hourly aggregator.
Summary cards:
- Announcements sent: total announcements delivered, with opened and clicked counts.
- Deliverability issues: bounced, complaint, and rejected counts.
- Unsubscribes: recipients who opted out during the period.
Charts and breakdowns:
- Engagement funnel: visualization of send-to-open-to-click conversion.
- Top engaged subscribers: leaderboard of subscribers with the highest engagement signals.
Knowledge & Engagement
Tracks how your Knowledge Base content is being used by visitors and the AI chat agent.
Charts:
- AI answers & Q&A card interactions: usage of the AI-powered chat and Q&A features on your Trust Center.
- Top documents downloaded: ranked list of the most-downloaded documents during the period.
Related Articles
Sharing Your Trust Center
How to share your Concord Trust Center with prospects, customers, and partners, including direct links, website embedding, email signatures, and sales outreach.
Trust Center Analytics
How to interpret Trust Dashboard metrics to understand visitor behavior, document engagement, and announcement performance.