Trust Center Analytics
How to interpret Trust Dashboard metrics to understand visitor behavior, document engagement, and announcement performance.
Overview
Trust Center analytics live on the Trust Dashboard. The Dashboard surfaces all visitor, document, workflow, and engagement metrics in one view.
Navigate to Trust > Dashboard and use the date range picker to select the reporting window.
Tracking Visitor Behavior
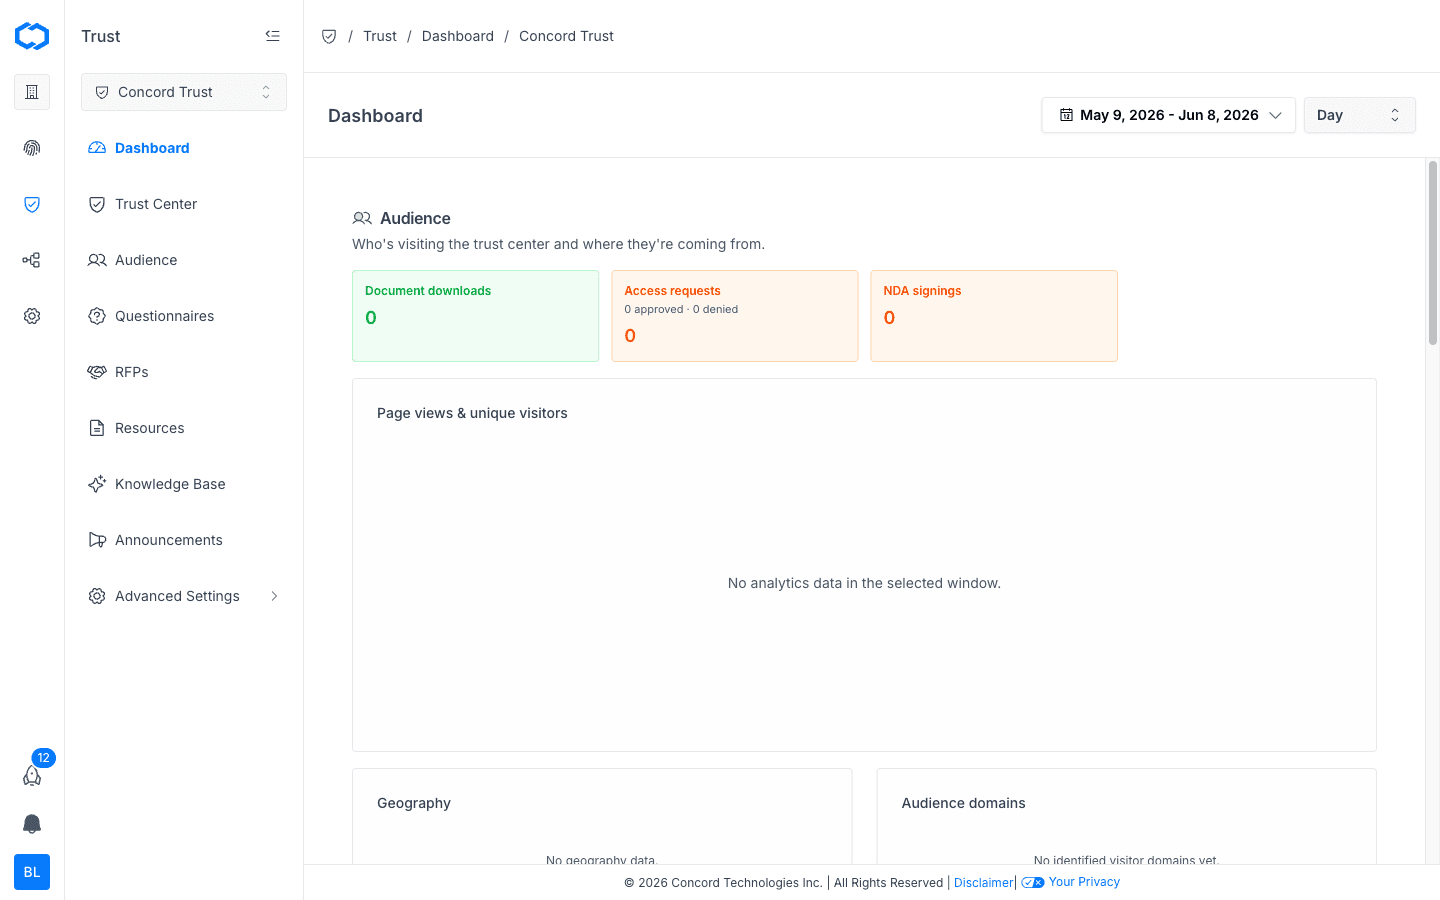
The Audience section of the Dashboard shows who is visiting your Trust Center:
- Page views & unique visitors charts traffic over time. Use this to spot spikes after you shares your Trust Center link or after you publish a new announcement.
- Geography breaks down visitors by region. This helps you understand where interest is concentrated and whether your Trust Center content aligns with the regulatory frameworks your audience cares about.
- Audience domains shows which organizations are reviewing your Trust Center based on visitor email domains.
Monitoring Document Engagement
Two metrics help you understand which documents get the most attention:
- Document downloads (Audience section) shows total downloads across all documents.
- Top documents downloaded (Knowledge & Engagement section) ranks documents by download count for the period.
If a specific document (your SOC 2 report, penetration test summary, or DPA) consistently ranks high, that signals what your audience prioritizes during security reviews. Use this to decide which documents to feature prominently.
Tracking Access Requests
The Access requests card in the Audience section shows total gated access requests with approved and denied counts. For detailed request management (approving, denying, and filtering requests by status), go to Trust > Audience.
Understanding Questionnaire Workflow
The Workflow section tracks:
- Avg days to complete measures cycle time from creation to completion.
- Questionnaires created vs. completed compares intake volume against completion rate over time.
Measuring Announcement Engagement
The Announcements section tracks delivery and engagement for subscriber announcements:
- Engagement funnel visualizes the send-to-open-to-click conversion path.
- Deliverability issues surfaces bounces, complaints, and rejected messages so you can clean your subscriber list.
- Top engaged subscribers identifies your most active readers.
AI and Knowledge Base Usage
The Knowledge & Engagement section shows how the AI chat agent and visitors interact with your Knowledge Base:
- AI answers & Q&A card interactions tracks usage of the AI-powered chat on your Trust Center.
Related Articles
Trust Dashboard Overview
Overview of the Concord Trust Dashboard, covering audience metrics, questionnaire workflow, announcement engagement, and knowledge base usage.
Concord Privacy Integration
How to connect Concord Privacy to your Trust Center to add cookie consent, regional privacy compliance, and a privacy request portal for visitors.